May Home Prices Unexpectedly Stall
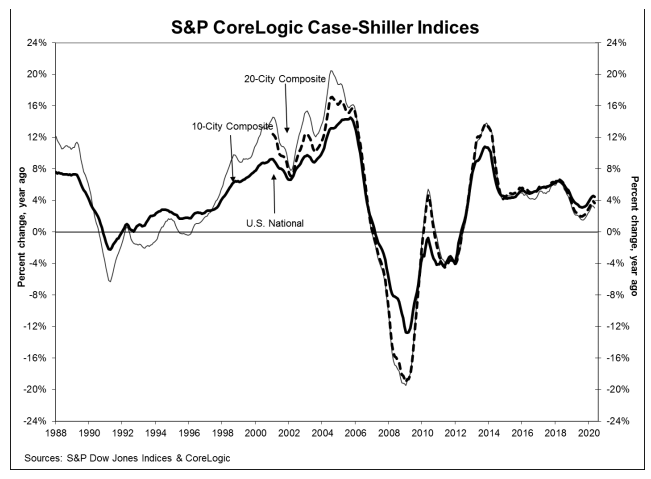
Home prices increases slowed slightly in May on both a month-over-month and an annual basis according to the S&P CoreLogic Case-Shiller Indices. The U.S. National Home Price Index which covers all nine U.S. census divisions, rose 4.5 percent in May compared to a year earlier. In April, the annual gain was 4.6 percent. There was an increase of 0.7 percent from April to May before seasonal adjustment and 0.1 percent afterward.
Case-Shiller again reported that, because of pandemic-related delays in the Wayne County, Michigan deed recording office, sales transactions for Detroit, are unavailable. Therefore, that city is not included in the composite indices.
The 10-City Composite and 20-City Composite each posted an annual increase that was 0.2 percentage point lower than the previous month. The 10-City gain was 3.1 percent and the 20-City rose 3.7 percent. On an unadjusted basis the 10-City Composite appreciated 0.3 percent for the month and the 20-City rose 0.4 percent. Both were unchanged from April on an adjusted basis. Seventeen of 19 cities (excluding Detroit) reported increases before seasonal adjustment, while 11 of the 19 cities reported increases after seasonal adjustment.
Phoenix, Seattle, and Tampa are again the top three metro areas for annual price increases. Phoenix led the way at 9.0 percent followed by Seattle with 6.8 percent and Tampa with 6.0 percent increases. Three of the 19 cities reported higher gains in the year ending May 2020 than in the year ending in April.
"May's housing price data were stable," says Craig J. Lazzara, Managing Director and Global Head of Index Investment Strategy at S&P Dow Jones Indices. "The National Composite Index rose by 4.5 percent in May 2020, with comparable growth in the 10- and 20-City Composites (up 3.1 percent and 3.7 percent, respectively). In contrast with the past eight months, May's gains were less than April's. Although prices increased in May, in other words, they did so at a decelerating rate. We observed an analogous development at the city level: prices increased in all 19 cities for which we have data, but accelerated in only 3 of them (in contrast with 12 cities last month and 18 the month before that).
"More data will obviously be required in order to know whether May's report represents a reversal of the previous path of accelerating prices or merely a slight deviation from an otherwise intact trend. Even if prices continue to decelerate, that is quite different from an environment in which prices actually decline.
"Among the cities, Phoenix retains the top spot for the 12th consecutive month, with a gain of 9.0 percent for May. Home prices in Seattle rose by 6.8 percent, followed by Tampa at 6.0 percent. As has been the case for the last several months, prices were particularly strong in the West and Southeast, and comparatively weak in the Northeast."
All three indices have surpassed their price levels prior to the Great Recession. The National Index is 18.6 percent higher than its 2006 peak and the 10-City and 20-City Indices are 4.7 percent and 8.8 percent higher, respectively.
The S&P CoreLogic Case-Shiller Home Price Indices are constructed to accurately track the price path of typical single-family home pairs for thousands of individual houses from the available universe of arms-length sales data. The National U.S. Home Price Index tracks the value of single-family housing within the United States. The indices have a base value of 100 in January 2000; thus, for example, a current index value of 150 translates to a 50 percent appreciation rate since January 2000 for a typical home located within the subject market.
As of May 2020, the National Index was at 218.87 compared to 217.72 in April. The 10- and 20-City Composites had readings of 236.98 and 224.76, respectively. Los Angeles has the highest index reading at 297.00 and Cleveland (absent data on Detroit) the lowest at 132.00.