
Will February Prove to be the Last Positive Home Sales Report for Now?
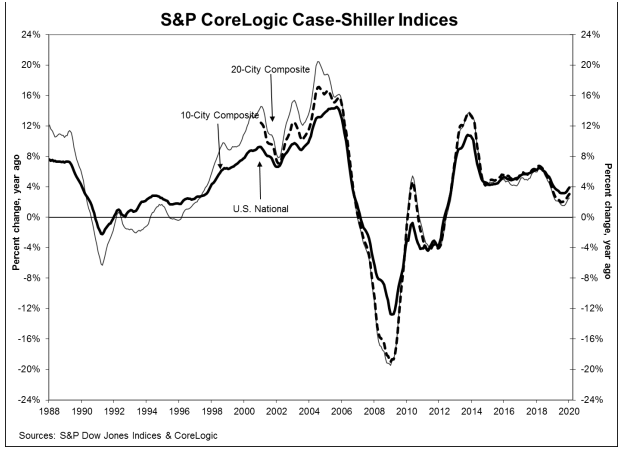
In what will probably prove to be the last full month of normal home sales for a while, prices of homes accelerated significantly. The S&P CoreLogic Case-Shiller U.S. National Home Price Index rose 4.2 percent in February compared to a year earlier. The index, which covers all nine U.S. census divisions, had posted a 3.9 percent annual increase in January.
The 10-City and 20-City Composite Indices had similar gains. The former was up 2.9 percent year-over-year compared to 2.6 percent in January while the 20-City's appreciation was 3.5 percent compared to 3.1 percent.
Phoenix again topped the list of 20 cities with an annual gain of 7.5 percent. It was followed by Seattle at 6.0 percent and Tampa and Charlotte, each at 5.2 percent. Seventeen of the 20 cities reported higher price increases in the year ending February 2020 versus the year ending January 2020.
The National Index and the 10-City Composite both rose 0.4 percent compared to their prices in January before seasonal adjustment while the 20-City rose 0.5 percent. After seasonal adjustment, the National Index was up 0.5 percent and the two composites rose 0.4 percent month-over-month. Nineteen of the 20 cities reported price growth before seasonal adjustment, and all did so afterward.
"The stable growth pattern established in the last half of 2019 continued into February," says Craig J. Lazzara, Managing Director and Global Head of Index Investment Strategy at S&P Dow Jones Indices. "The National Composite Index rose by 4.2 percent in February 2020, and the 10- and 20-City Composites also advanced (by 2.9 percent and 3.5 percent, respectively). Results for the month were broad-based, with gains in every city in our 20-City Composite; 17 of the 20 cities saw accelerating prices. The National, 10-City, and 20-City Composites all rose at a faster rate in February than they had in January.
"At a regional level, Phoenix retains the top spot for the ninth consecutive month, with a gain of 7.5 percent for February. Home prices in Seattle rose by 6.0 percent, with Tampa and Charlotte prices both gaining 5.2 percent. Prices were particularly strong in the West and Southeast, and comparatively weak in the Midwest and Northeast.
"Importantly, today's report covers real estate transactions closed during the month of February and shows no signs of any adverse effect from the governmental suppression of economic activity in response to the COVID-19 pandemic. As much of the U.S. economy was shuttered in March, next month's data may begin to reflect the impact of these policies on the housing market."
All three indices are higher than the peaks they reached in the summer of 2006, prior to the housing crisis. The National Index is 15.5 percent above that peak, the 20-City has a 6.4 percent edge and the 10-City is 2.7 percent higher.
The S&P CoreLogic Case-Shiller Home Price Indices are constructed to accurately track the price path of typical single-family home pairs for thousands of individual houses from the available universe of arms-length sales data. The National U.S. Home Price Index tracks the value of single-family housing within the United States. The indices have a base value of 100 in January 2000; thus, for example, a current index value of 150 translates to a 50 percent appreciation rate since January 2000 for a typical home located within the subject market.
As of January 2020, the National Index was at 213.16 compared to 212.43 in January. The 10- and 20-City Composites had readings of 233.32 and 219.75 respectively, compared to 231.27 and 218.62 the prior month. Los Angeles has the highest index at 290.67 and Cleveland the lowest at 126.61.