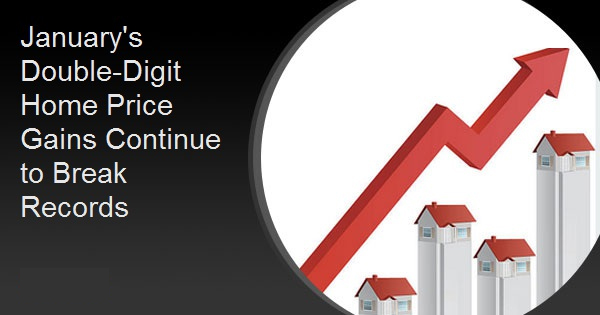
January's Double-Digit Home Price Gains Continue to Break Records
The S&P CoreLogic Case-Shiller home price indices and the Federal Housing Finance Agency's (FHFA's) House Price Index (HPI) all show that the growth of home prices continued to accelerate through January, even as interest rates began to creep higher.
Case-Shiller's National Home Price Index, which covers all nine U.S. census divisions, rose 11.2 percent compared to its January 2020 level. The annual gain in December was 10.4 percent. The 10-City Composite Index posted an annual increase of 10.9 percent, a full percentage point above its 12-month gain the previous month. The 20-City Composite, with Detroit's data now included in the calculations, was up 11.1 percent compared to January of last year. Annual appreciation was 10.2 percent in December.
Phoenix, Seattle, and San Diego continued to report the highest year-over-year gains among the 20 cities, with Phoenix in the led for the 20th month. That city's January increase was 15.8 percent. Seattle and San Diego followed with respective increases of 14.3 percent and 14.2 percent. All 20 cities reported higher price increases in the year ending January 2021 versus the year ending December 2020.
On a month-over-month basis the National Index rose 0.8 percent on a non-seasonally adjusted basis and the 10-City and 20-City Composites posted increases of 0.8 percent and 0.9 percent. All three indices were up 1.2 percent after adjustment. Nineteen of 19 of 20 cities had gains from December before seasonal adjustment, and all 20 cities did so afterward. Sixteen of those cities had growth in double digits.
Craig J. Lazzara, Managing Director and S&P Dow Jones Global Head of Index Investment Strategy, said, "The trend of accelerating prices that began in June 2020 has now reached its eighth month and is also reflected in the 10- and 20-City Composites. The market's strength is broadly-based: all 20 cities rose, and all 20 cities gained more in the 12 months ended in January 2021 than they had gained in the 12 months ended in December 2020.

"January's performance is particularly impressive in historical context. The National Composite's 11.2 percent gain is the highest recorded since February 2006, just one month shy of 15 years ago. In more than 30 years of S&P CoreLogic Case-Shiller data, January's year-over-year change is comfortably in the top decile. That strength is reflected across all 20 cities. January's price gains in every city are above that city's median level, and rank in the top quartile of all reports in 18 cities.
"January's data remain consistent with the view that COVID has encouraged potential buyers to move from urban apartments to suburban homes. This demand may represent buyers who accelerated purchases that would have happened anyway over the next several years. Alternatively, there may have been a secular change in preferences, leading to a shift in the demand curve for housing. Future data will be required to analyze this question.
CoreLogic Deputy Chief Economist Selma Hepp said, "While double-digit home price growth has raised concerns about its sustainability, affordability crunch resulting from strong home price growth and higher mortgage rates will discourage some potential home buyers from entering the market and take some wind out of its sails, slowing the home price growth rate by about a half by the end of 2021. The biggest concern remains the lack of for-sale homes. Potential sellers may be discouraged by their inability to find a new home and subsequently choose to not list their own home - leading to a vicious cycle of declining for-sale homes."
The S&P CoreLogic Case-Shiller Home Price Indices are constructed to accurately track the price path of typical single-family home pairs for thousands of individual houses from the available universe of arms-length sales data. The National U.S. Home Price Index tracks the value of single-family housing within the United States. The indices have a base value of 100 in January 2000; thus, for example, a current index value of 150 translates to a 50 percent appreciation rate since January 2000 for a typical home located within the subject market.
As of January 2021, the National Index was at 236.31 compared to 234.40 in December. The 10- and 20-CityComposites had readings of 256.50 and 242.98, up from to 254.18 and 240.75 the prior month. Los Angeles has the highest index reading at 321.04. Over the many months that COVID-19 related problems made Detroit data unavailable, the city it nearly displaced Cleveland from its last place position. Detroit's reading was 141.29, leaving Cleveland still with the lowest index at 141.28.
FHFA's HMI posted slightly higher January numbers than those from Case-Shiller, up 12 percent year-over-year compared to an annual gain of 11.4 percent the prior month. The monthly gain was 1.0 percent in January and the previously reported 1.1 percent price change for December 2020 was revised upward to 1.2 percent.
Among the nine census divisions, seasonally adjusted monthly house price changes ranged from a 0.2 percent decline in the East South Central division to a 1.5 percent gain in the Mountain division. Annual changes ranged from 10.2 percent in the West South Central division to 14.8 percent in the Mountain division.

"While house prices experienced historic growth rates in 2020 and into the new year, the monthly gains appear to be moderating" said Dr. Lynn Fisher, FHFA's Deputy Director of the Division of Research and Statistics. "House prices increased by 1.0 percent in January, which is relatively still high, but represents the smallest month-over-month gain since June 2020."
The FHFA HPI is based on sales prices of homes financed by mortgages acquired by the GSEs Fannie Mae and Freddie Mac. The index was benchmarked at 100 in January 1991 and the current reading is 316.70.